Foretell Vista — Retail Demand Forecasting & Inventory Optimisation
A multi-tenant retail analytics platform: a 45-feature gradient-boosting demand model with conformal prediction intervals, PSI-based drift monitoring, a three-estimator causal ensemble that warns when its own methods disagree, a signed product-substitution graph, and an inventory simulator with an RL baseline — on a 73,100-row retail dataset.
// outcome
- 71.6
- 92.0
- 73,100
- −12.8%
// problem
Demand forecasting in retail has to balance product-level signal, cross-product elasticity, and the privacy constraints of each stakeholder's silo — while explaining which campaign is actually driving the lift, and noticing when the model has quietly stopped fitting.
// approach
Normalise messy vendor CSVs through an alias-resolving registry, forecast with a gradient-boosted model over 45 lag, rolling, calendar, price and competitor features, bound the uncertainty with split-conformal intervals, and triangulate promotion effects with three independent estimators instead of trusting one. The replenishment layer is a SimPy simulator with an RL policy and a heuristic baseline measured against each other.
// results
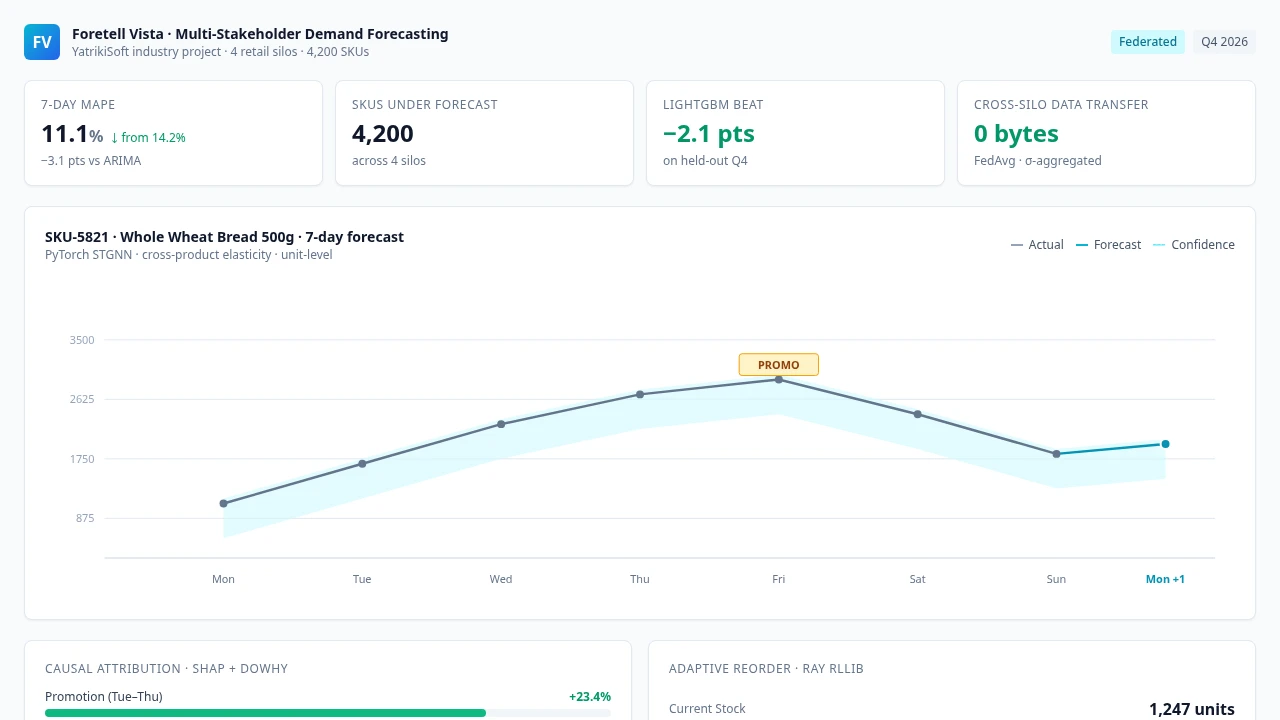
- Forecast MAE 71.6 and RMSE 92.0 on a held-out validation window, against a naive lag-1 baseline MAE of 89.2
- Causal ensemble that reports its own disagreement — 187% spread across three estimators on the same estimate
- Signed product-substitution graph: complements and substitutes as edges, SVD embeddings, anchored to a fixed seed
- PSI drift monitoring over six features on a 60-day baseline against a 14-day window, with severity thresholds
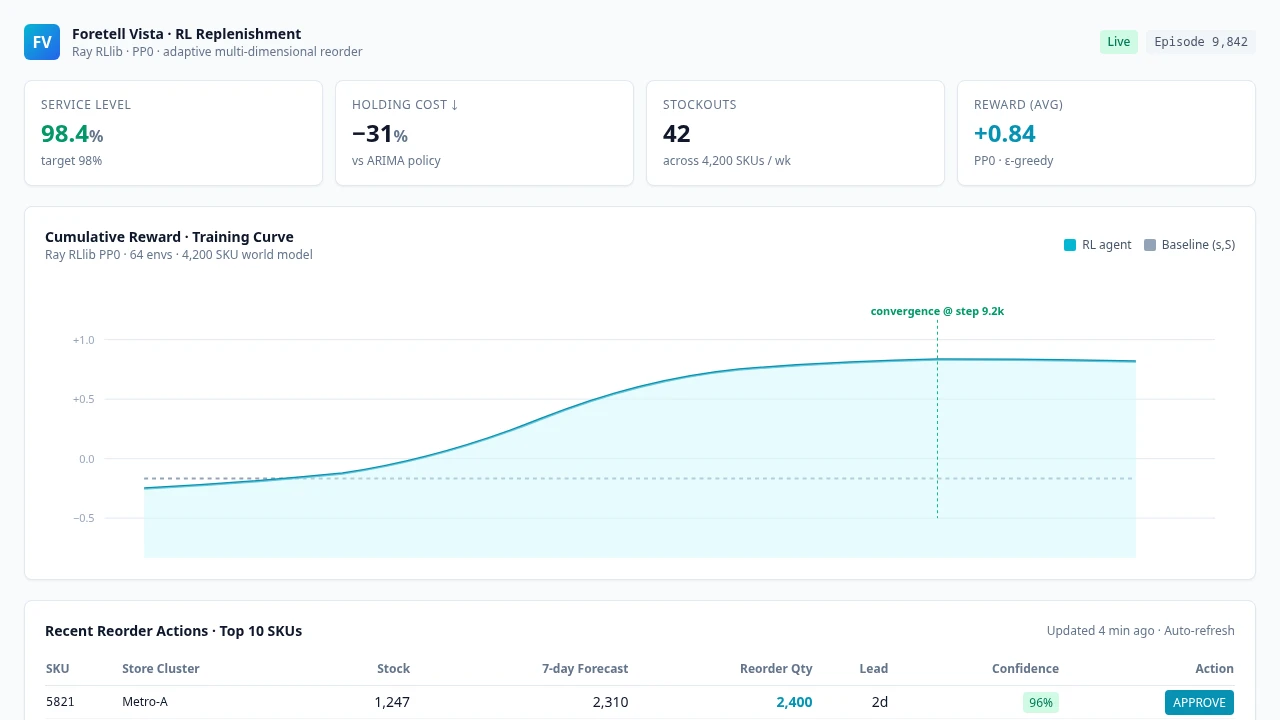
- 12.8% lower total inventory cost for the RL policy against the (s,S) baseline, measured over 8 series
// screens
// in depth
Ingestion is half the problem
Retail data arrives in whatever shape the vendor had. The dataset registry resolves it:
a column-alias map folds sales, units_sold, qty and demand onto one field, the
frame is re-aggregated to (store_id, product_id, date), and fields the file did not
carry are derived — competitor_price from price, seasonality from the month,
inventory_level as seven days of sales when it is missing. CSV, JSON and XLSX all go
in.
The underlying dataset is 73,100 rows across five stores and twenty products over two years, of which 14,611 rows form the grocery subset and 100 store-product series.
Zero-demand is censored data, not zero
The subtlest thing in the forecasting code is what it does with a row where inventory
was at or below zero and nothing was sold. That is not a demand of zero — it is a
demand that was never observable, because the shelf was empty. Those rows are set to
missing and interpolated with limit_direction="both", rather than being trained on as
zeros.
Uncertainty, and when it goes missing
Prediction intervals come from split-conformal regression where MAPIE is available, and fall back to a Gaussian interval built from the validation residual spread otherwise. The committed model reports a validation residual standard deviation of 65.8 alongside its MAE and RMSE.
Drift is watched separately. A hand-rolled Population Stability Index over ten bins on six numeric features compares a 60-day baseline against a recent 14-day window, with severity thresholds at PSI 0.1 / 0.25 / 0.5 and mean-shift thresholds at 15 / 30 / 50%. A scan history keeps the last hundred readings.
Causal, and honest about its own uncertainty
Most forecasters answer “what will demand be.” Foretell Vista also answers “what moved it” — and is careful about the answer. Three independent estimators are run and combined by inverse-variance proxy weighting:
| Estimator | Approach |
|---|---|
| PSM | Propensity score from a logistic model, matched by nearest neighbour |
| DML | Random-forest nuisance estimates, residual regression on a logistic model |
| DiD | Treated and control store × product groups differenced over time |
When those three disagree, the platform says so. On the shipped data the spread between them is 187% — and the response carries a warning rather than a single confident number. Feature attribution runs through SHAP where it is available, with a permutation-importance fallback, and the causal factor breakdown reports price, month, season and weather contributions directly.
The product graph
Complements and substitutes are the same correlation with opposite signs, so the graph is signed: a positive correlation is an edge from a complement, a negative one a substitute. Nodes are the top SKUs by rank, tiered into anchor, core, growth and niche by rank ratio, with a fixed spring-layout seed so the picture does not move between renders. There is a fallback that keeps the strongest edges when the correlation threshold would otherwise produce an empty graph.
Embeddings come from an SVD of the signed adjacency matrix — spectral vectors scaled by singular value, then combined with the feature matrix. It is not message passing, and it is not a learned GNN; it is a cheap way to get the graph structure into the same feature space as the demand features.
Replenishment, measured against a baseline
Inventory is simulated in SimPy, and a PPO policy trained with Stable-Baselines3 is compared against a fixed heuristic on the same episodes. Over eight series the RL policy reaches a 12.8% lower total inventory cost than the (s,S) baseline, with average inventory down from 1,842 to 1,607 units. The service level is held at 100% for both, so the saving is not bought with stockouts.
The trained policy is evaluated against a served heuristic in production, and the comparison is what the platform reports — the number on the dashboard is the difference between two policies on the same world model, not a score in isolation.
Scope
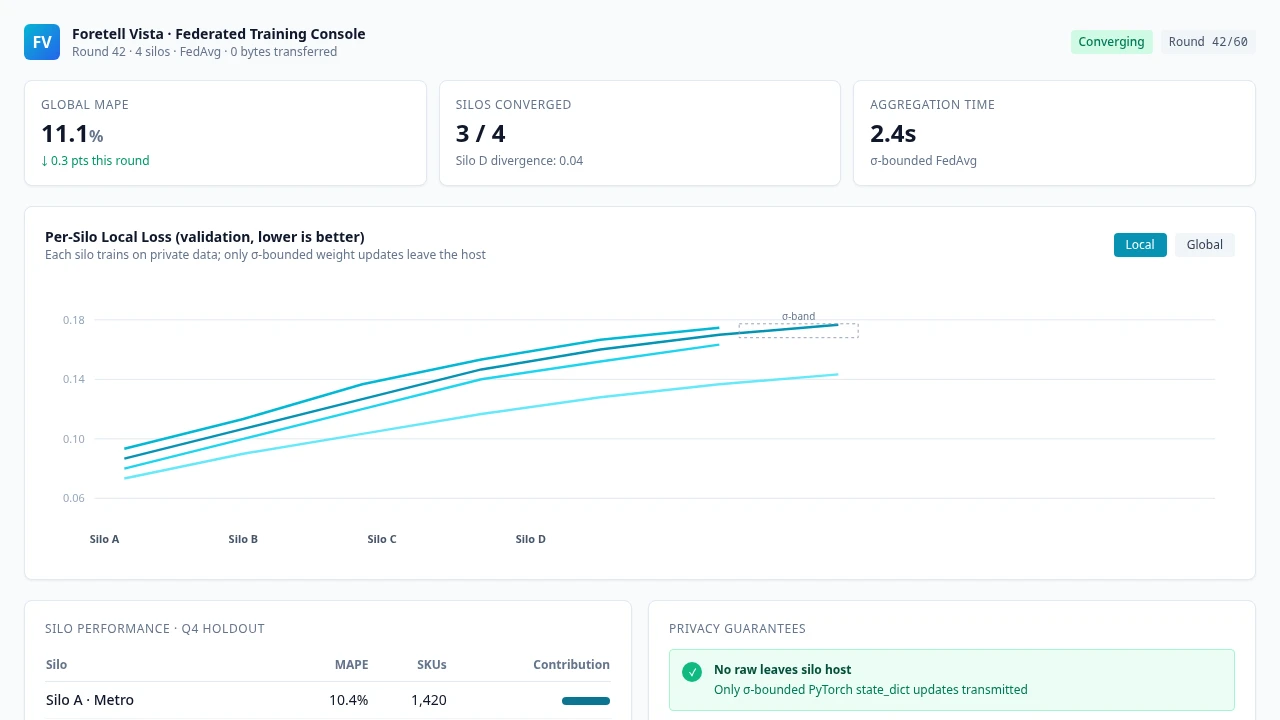
The federated layer simulates rounds of cross-silo aggregation over the store partitions — five rounds, four participants per round — and the project’s own task list records that it should be replaced with true cross-client training. That is stated here rather than dressed up: the current implementation approximates the privacy-preserving workflow, and the replacement is the next piece of work.